From raw data to results and summary tables
%pylab inline
import warnings
warnings.filterwarnings('ignore')
import scipy.io as io
import numpy as np
import pandas as pd
import statsmodels.api as sm
from statsmodels.formula.api import ols
import json
import seaborn as sns
sns.set(style="white", context="talk")
Populating the interactive namespace from numpy and matplotlib
From raw data to results and summary tables
def entropy(labels, base=None):
    n_labels = len(labels)
    if n_labels <= 1:
        return 0
    value,counts = np.unique(labels, return_counts=True)
    probs = counts / n_labels
    n_classes = np.count_nonzero(probs)
    if n_classes <= 1:
        return 0
    ent = 0.
    base = e if base is None else base
    for i in probs:
        ent -= i * np.math.log(i, base)
    return ent
raw_data = pd.read_csv('Zooniverse_Data_2022_01_28.csv', engine='python') # all the data
raw_data_dic = raw_data['annotations'].to_dict() # info on the responses
raw_ID = raw_data['subject_data'].to_dict() # info on the images
user_id = raw_data['user_id'].to_dict() # info on the raterstable = pd.DataFrame(columns=['rater','image_ID','image_name','Resp1','Resp2','Cat1','Cat2','Cat3'])
for image in np.arange(len(raw_data_dic.keys())):
dic_on_image = json.loads(raw_ID.get(image))
image_ID = list(dic_on_image.keys())[0] # image ID
dic_on_resp = json.loads(raw_data_dic.get(image))
rater = user_id[image]
try:
image_name = dic_on_image.get(image_ID)['Filename']
except:
image_name = dic_on_image.get(image_ID)['image_name_1']
image_resp1 = nan
image_resp2 = nan
image_cat1 = nan
image_cat2 = nan
image_cat3 = nan
for task in np.arange(len(dic_on_resp)):
if dic_on_resp[task].get('task') == 'T1':
image_resp1 = dic_on_resp[task].get('value') # first name
if dic_on_resp[task].get('task') == 'T2':
image_resp2 = dic_on_resp[task].get('value') # second name
if dic_on_resp[task].get('task') == 'T4':
image_cat1 = dic_on_resp[task].get('value') # image_cat1
if dic_on_resp[task].get('task') == 'T3':
image_cat2 = dic_on_resp[task].get('value') # image_cat2
if dic_on_resp[task].get('task') == 'T5':
image_cat2 = dic_on_resp[task].get('value') # image_cat2
if dic_on_resp[task].get('task') == 'T6':
image_cat3 = dic_on_resp[task].get('value') # image_cat3
if dic_on_resp[task].get('task') == 'T7':
image_cat3 = dic_on_resp[task].get('value') # image_cat3
if dic_on_resp[task].get('task') == 'T8':
image_cat3 = dic_on_resp[task].get('value') # image_cat3
if dic_on_resp[task].get('task') == 'T9':
image_cat3 = dic_on_resp[task].get('value') # image_cat3
table.loc[image] = [rater,image_ID,image_name,image_resp1,image_resp2,image_cat1,image_cat2,image_cat3]table2 = pd.DataFrame(columns=['image_ID','image_name','howmany','Resp1','Resp2',
'Cat1','Cat2','Cat3',
'Cat1_agr','Cat2_agr','Cat3_agr',
'Comp_dem','Most_comm','Entropy'])
for image in np.arange(len(table['image_ID'].unique())):
checking = table['image_ID'].unique()[image]
howmany = len(table[table['image_ID']==checking])
image_name = table[table['image_ID']==checking]['image_name'].unique()[0]
Resp1 = table[table['image_ID']==checking]['Resp1'].str.lower().str.rstrip().value_counts(ascending=False)
Resp2 = table[table['image_ID']==checking]['Resp2'].str.lower().str.rstrip().value_counts(ascending=False)
for t,tt in enumerate(table[table['image_ID']==checking]['Cat1'][table[table['image_ID']==checking]['Cat1']=='animate and/or living'].index):
table.loc[tt,'Cat1'] = 'animate / living'
Cat1 = table[table['image_ID']==checking]['Cat1'].value_counts(ascending=False)
for t,tt in enumerate(table[table['image_ID']==checking]['Cat1'][table[table['image_ID']==checking]['Cat1']=='inanimate and/or nonliving'].index):
table.loc[tt,'Cat1'] = 'inanimate / nonliving'
Cat1 = table[table['image_ID']==checking]['Cat1'].value_counts(ascending=False)
Cat2 = table[table['image_ID']==checking]['Cat2'].value_counts(ascending=False)
Cat3 = table[table['image_ID']==checking]['Cat3'].value_counts(ascending=False)
# % agreement on Cat1
if Cat1[0]==howmany:
agreement1 = 100
else:
agreement1 = (Cat1[0]/howmany)*100
# % agreement on Cat2
if Cat2[0]==howmany:
agreement2 = 100
else:
agreement2 = (Cat2[0]/howmany)*100
# % agreement on Cat3
if len(Cat3) ==0:
agreement3 = nan
elif Cat3[0]==howmany:
agreement3 = 100
else:
agreement3 = (Cat3[0]/howmany)*100
# ratio between the percentage of subjects providing
# the most common response and the second most common one
if len(Resp1)>2:
comp_dem = ((Resp1[0]/howmany)*100)/((Resp1[1]/howmany)*100)
else:
comp_dem = 0
# percentage of subjects providing the most common response
most_comm = (Resp1[0]/howmany)*100
# Entropy/H-index:
#ent = entropy(np.array(table[table['image_ID']==checking]['Resp1'].str.lower().str.rstrip()))
s = pd.Series(np.array(table[table['image_ID']==checking]['Resp1'].str.lower().str.rstrip()))
ent = entropy(s.dropna().values)
table2.loc[image] = [checking,image_name,howmany,dict(Resp1),dict(Resp2),
dict(Cat1),dict(Cat2),dict(Cat3),
agreement1,agreement2,agreement3,
comp_dem,most_comm,ent]Basic Plots
summary_data = pd.read_csv('Zooniverse_Results_Summary_2022_01_29.csv') # all the dataf, (ax1,ax2,ax3) = plt.subplots(1, 3, figsize=(20, 6), sharey=True)
a = ax1.hist(summary_data['Cat1_agr'])
b = ax2.hist(summary_data['Cat2_agr'])
c = ax3.hist(summary_data['Cat3_agr'])
ax1.set_xlabel("% agreement living vs. nonliving")
ax2.set_xlabel("% agreement natural vs. artificial")
ax3.set_xlabel("% agreement category")
ax1.set_ylabel("How many images")
sns.despine(left=False, right=True, bottom=False, top=True)
plt.show()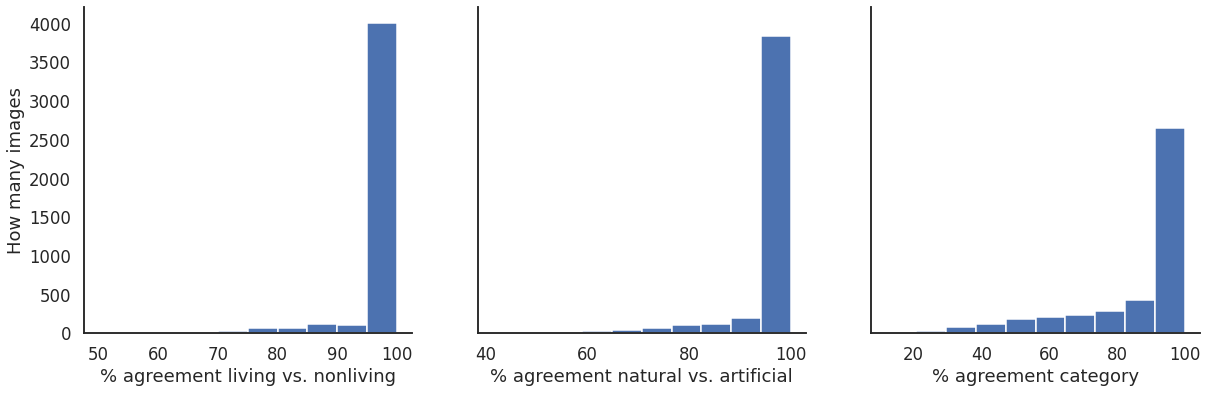
f, (ax4,ax5,ax6) = plt.subplots(1, 3, figsize=(20, 6), sharey=True)

d = ax4.hist(summary_data['Comp_dem'])
e = ax5.hist(summary_data['Most_comm'])
f = ax6.hist(summary_data['Entropy'])

ax4.set_xlabel("ratio of two most common responses")
ax5.set_xlabel("% most common response")
ax6.set_xlabel("entropy of responses")

ax4.set_ylabel("How many images")

sns.despine(left=False, right=True, bottom=False, top=True)

plt.show()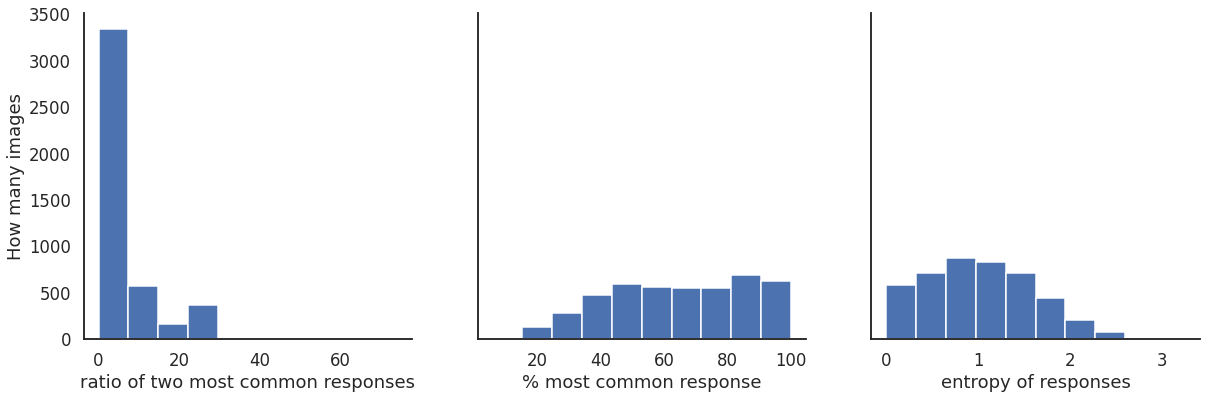
Check dropped ones and hard ones
dropped = summary_data[summary_data.howmany_saw-summary_data.howmany_name>1]
dropped.describe()
Loading...
f, (ax4,ax5) = plt.subplots(1, 2, figsize=(18, 6), sharey=False, sharex=False)

d = ax4.scatter(summary_data['howmany_name'],summary_data['howmany_saw'])
e = ax5.hist(summary_data['howmany_saw']-summary_data['howmany_name'])

ax4.set_xlabel("# has been named")
ax4.set_ylabel("# has been seen")

ax5.set_xlabel("difference (saw-name)")
ax5.set_ylabel("how many images")

sns.despine(left=False, right=True, bottom=False, top=True)

plt.show()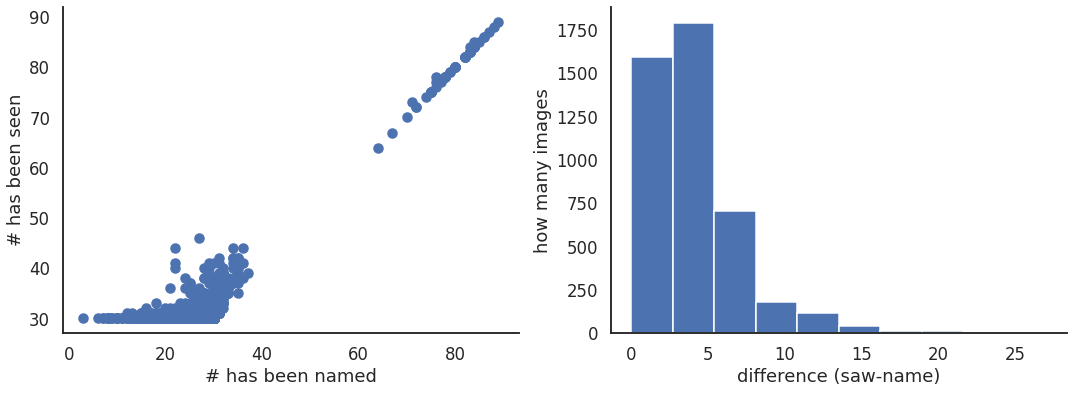
few_answers = summary_data[summary_data['howmany_name']<10]
many_answers = summary_data[summary_data['howmany_name']>20]few_answers[few_answers['Most_comm']<20]Loading...
summary_data[summary_data['image_ID']==72053753]Loading...
many_answers[many_answers['Most_comm']<13]Loading...
many_answers[many_answers['Most_comm']<30]Loading...
Else
summary_data['dropped'] = summary_data.howmany_saw-summary_data.howmany_namesummary_dataLoading...
summary_data.iloc[4465].Resp1Loading...